
Crop residue burning in Punjab not main culprit of air pollution in Delhi: Study
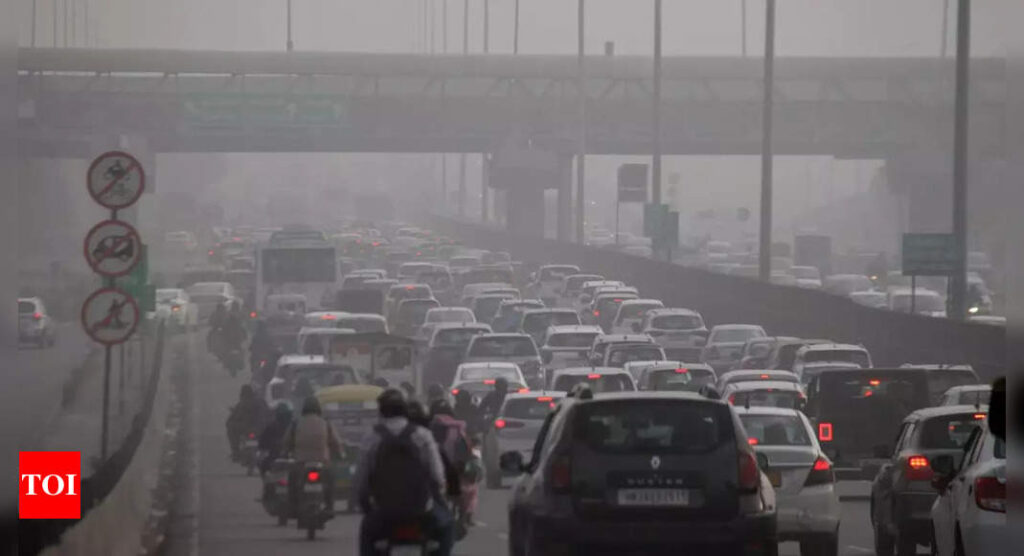
CHANDIGARH: More than crop residue burning in Punjab, it is the industrial, transport, and domestic sector activities in Delhi and surrounding regions that lead to increasing carbon monoxide levels in the national capital territory of Delhi and nearby cities, a study has revealed. Stubble burning has been identified as a major contributor to air pollution in NCT, with approximately 75% of smoke emanating from Punjab.
The study, “Source attribution of carbon monoxide over Northern India”, during crop residue burning period over Punjab” was conducted by researchers from the Indian Institute of Remote Sensing, Dehradun, and the National Center for Atmospheric Research, Boulder, USA.
Delhi and surrounding areas — Meerut, Ghaziabad, Noida, Greater Noida, Faridabad and Gurugram — suffer from poor air quality during the post-monsoon months of Oct–Nov. The study aimed to quantify the contributions of various emission sources, including industrial, residential, power generation, transportation, biomass burning, photochemical production, and lateral transport, to the concentration of carbon monoxide, a key air pollutant, in North India.
The simulation results of the sector contribution of carbon monoxide in the National Capital revealed that crop residue burning accounted for 15.8% to 29.9% of total emissions, with 11.7% to 23.3% attributed to farm fires in Punjab. Anthropogenic sources, comprising human activities that impact the environment, contributed 53.4% to 77.2% of total emissions, with the residential, transportation, and industrial sectors being the largest contributors.
The transport sector was the largest contributor to carbon monoxide emissions, accounting for 55.4% of the total. This is likely attributed to the presence of older emissions, exceeding a decade in age. In contrast, the background concentration in Delhi had a relatively minor contribution, ranging from 2.9% to 5.4%. Meanwhile, emissions from other sources varied, accounting for 4.2% to 17.1% of the total carbon monoxide emissions.
The analysis of sector contributors in Punjab revealed that widespread paddy waste burning significantly impacted carbon monoxide air pollution, contributing 56.2% to 76.5% of total surface carbon monoxide concentration, with approximately 94% of these emissions originating locally within Punjab. In contrast, anthropogenic sector emissions account for 13.6% to 30%, primarily driven by the residential sector. Background concentration and other sectors were relatively minor contributions, ranging from 4.5% to 5.7% and 3.6% to 8.1%, respectively. However, it is essential to note that satellite imaging may underestimate emissions from crop residue burning due to the inability to detect small-sized fires in agricultural fields.
The study which also examined the impact of critical meteorological parameters on carbon monoxide concentration revealed that deteriorating air quality in the North Indian region is caused by a combination of unfavourable meteorological conditions, such as slow winds, shallow mixing layers, and cold temperatures, coupled with man-made emissions. The study conducted by Abhinav Sharma, Shuchita Srivastava, R Kumar, and D Mitra, has been published in the latest edition of the international journal, Environmental Pollution.
Method employed
Researchers used the Weather Research and Forecasting model with Chemistry (WRF-Chem) to simulate surface carbon monoxide concentrations over North India during the peak paddy residue burning period in Punjab from Oct 28 to Nov 16, 2021.
A researcher explained that the model incorporated 12 additional carbon monoxide tracers to represent emissions from various sources and utilized six global anthropogenic emission inventories and three biomass-burning emission inventories. The simulation results were validated by comparing them with Measurements of Pollution in the Troposphere (MOPITT) retrieved surface carbon monoxide data, demonstrating WRF-Chem’s ability to produce realistic carbon monoxide distributions with low bias.